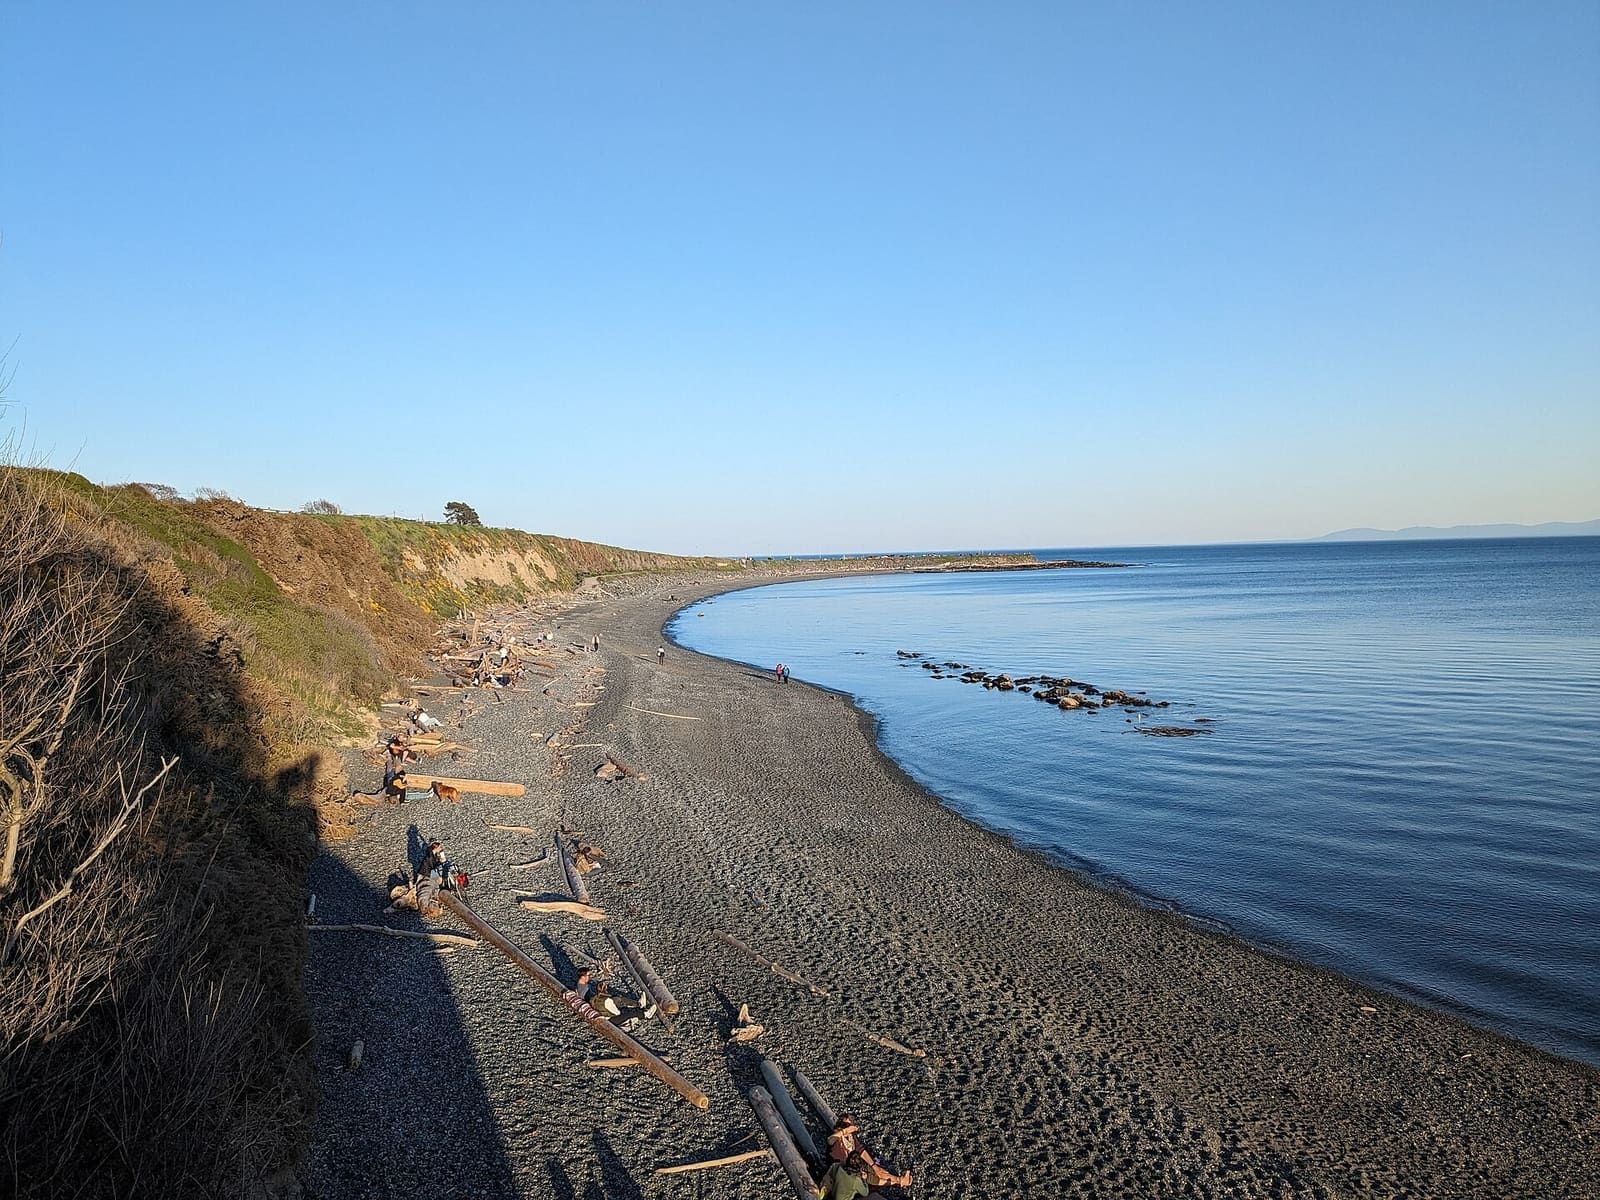

These are the Canadian Hydrographic Service’s predicted high and low tides for six stations around Victoria, for about the next month, refreshed daily. Pick a station and a date for the times and heights, sunrise and sunset, and any daylight extra-low tide (a possible tide-pool window). Victoria’s tides are mixed: some days have two highs and two lows, others one of each.
Tide times for Victoria and area
| Date | Highs and lows | Sunrise and sunset |
|---|---|---|
| Mon, Oct 19 | Low 4:00 am 1.0 m · High 1:59 pm 2.5 m | 7:40 am to 6:16 pm |
| Tue, Oct 20 | Low 5:03 am 1.1 m · High 1:54 pm 2.5 m | 7:41 am to 6:14 pm |
| Wed, Oct 21 | Low 6:01 am 1.2 m · High 1:45 pm 2.4 m · Low 7:35 pm 1.9 m | 7:43 am to 6:13 pm |
| Thu, Oct 22 | High 12:03 am 2.0 m · Low 6:48 am 1.3 m · High 1:38 pm 2.4 m · Low 7:53 pm 1.6 m | 7:44 am to 6:11 pm |
| Fri, Oct 23 | High 1:28 am 2.0 m · Low 7:27 am 1.5 m · High 1:44 pm 2.5 m · Low 8:22 pm 1.3 m | 7:46 am to 6:09 pm |
| Sat, Oct 24 | High 2:31 am 2.1 m · Low 8:01 am 1.7 m · High 1:59 pm 2.5 m · Low 8:55 pm 0.9 m | 7:47 am to 6:07 pm |
| Sun, Oct 25 | High 3:33 am 2.2 m · Low 8:34 am 1.9 m · High 2:16 pm 2.7 m · Low 9:32 pm 0.6 m | 7:49 am to 6:05 pm |
Reading the table
Times are Pacific time (UTC-7 from 1 November 2026). Heights are in metres above chart datum, CHS’s reference level for tide tables and charts, so they are not heights above sea level or above the beach. A higher number means more water.
Tide pools and beaches
Tide pools show best at low tide. The beach pages say which beaches their official pages describe as tide-dependent, and link here with the nearest station selected. Always check the park’s own safety advice, and watch the water: a rising tide can cut off rocks and spits.
About this data
This product is made by us from CHS data under CHS’s licence, which allows not-for-profit derivative products and forbids navigation use and redistribution. We publish the predictions only inside these pages, not as a data file. The required CHS notice is shown under the planner.
Frequently asked questions
Where do these tide times come from?
From the Canadian Hydrographic Service (CHS), the Government of Canada’s tide authority, through its water-level service. A scheduled job fetches the predictions every day and the pages are rebuilt with them; your browser never contacts CHS. CHS says the official Canadian Tide and Current Tables prevail if there is any difference.
Can I use this for boating?
No. CHS’s licence says the data must not be used for navigation, and so does this page. Use official CHS products for navigation.
What is an extra-low tide and a tide-pool window?
These are our labels. A low tide is “extra low” when it is in the lowest quarter of the predicted lows over the days shown. A tide-pool window is from an hour before to an hour after such a low that falls in daylight. Which shore has pools, and how safe the rocks are, is for the park’s own advice.
Why are some days different from others?
Tides on this coast are mixed: the two highs and two lows in a day are often unequal, and on some days only one high and one low occur. The table shows exactly what CHS predicts for the day.
Why does the chart look smooth?
It is a curve drawn between the predicted highs and lows to show the shape of the day. Only the highs and lows are CHS predictions; heights between them are an approximation.
Which station is nearest my beach?
Clover Point for the Dallas Road and Ross Bay shore, Oak Bay for Willows and Cadboro Bay, Victoria Harbour for the Inner Harbour, Sidney for the Saanich Peninsula, Sooke and Becher Bay for the west. Beach pages link here with the nearest station selected.
More in Things to do
- Things to do in Victoria BCHub
- Craigdarroch CastleGuide
- Butchart GardensGuide
- Whale watchingGuide
- Royal BC MuseumGuide
- Afternoon teaGuide
- Day trips from VictoriaGuide
- Sunset times and spotsGuide
- BeachesGuide
- Bike rental and trailsGuide
- Hikes near VictoriaGuide
- Scenic drivesGuide
- Food in VictoriaGuide